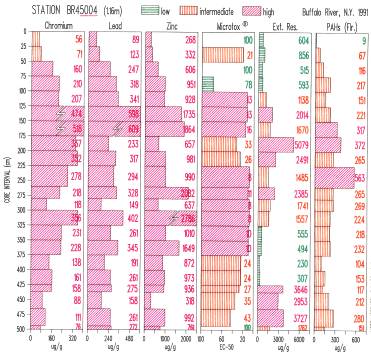
Tandem bar graph
USEPA
The graph represents vertical profiles of six pollutant measurements (horizontal axis) in a vibracore. The depth interval of each sample is shown on the vertical axis at left. Numbers opposite the bars indicate the actual measurement values. Bar colors indicate whether measurements are regarded as being in the low, medium or high range.