
Color contour map |
Rouge Program Office |
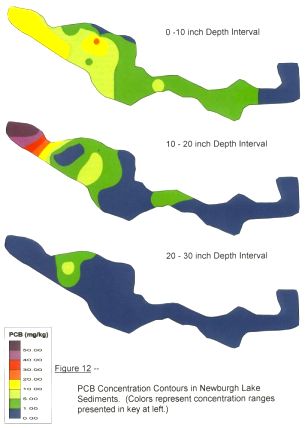
PCB concentrations in sediments of this impoundment have been contour-mapped at three levels. Contouring programs interpolate values between discrete data points to produce these concentration boundaries. Contour maps are useful to help visualize distribution patterns, but may or may not be entirely accurate, depending on data quality and quantity. |
">

">
">
">