
3-D data model |
USEPA |
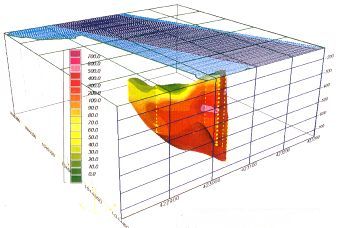
Data modeling programs may interpolate data in all three dimensions. In order to be realistic they require relatively dense arrays of data points. |
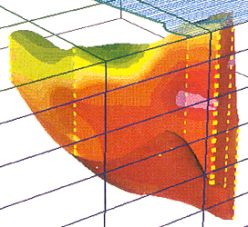
In this example from a Great Lakes harbor, lead concentrations in a sediment deposit were modeled in 3D using about 150 data points representing 10 vibracores collected within an area of roughly 50 x 200 feet. The color key indicates concentration levels from low (green) to high (purple). Note the "hot spot" at right center. The vertical rows of yellow dots represent discrete sub-samples taken within cores. |